sprite
Hi {{ home.name }}, since your plan has expired/canceled, you are now reduced to a user and your plan benefits are now lowered. Remove your exceeded plan benefits or Upgrade now
The teams you are a part of havehas expired. Contact your team owners to Upgrade. Or Remove yourself from the expired team
{{ home.name }}, to use your account, you need to confirm your email : Didn't receive email? Resend email
Success! Your confirmation email has been sent.

Create Infographics with 65 Free and Premium Infographic Templates

Category toggle

{{val.title}}

{{ val.title }}

|

({{val.pin_category }})

{{ val.page_count }}
{{ val.pin_group_parent[0].pin_group_childs.length }}
Online Editable Coronavirus Awareness Process Infographic

Online Editable Coronavirus Awareness Process Infographic

Infographic | Process

Online Editable 92nd Academy Awards Winners Statistics Infographic

Online Editable 92nd Academy Awards Winners Statistics Infographic

Infographic | Statistics

Online Editable Minimalist Protein Rich Foods Statistics Infographic

Online Editable Minimalist Protein Rich Foods Statistics Infographic

Infographic | Statistics

Online Editable Cyber Safety Process Infographic

Online Editable Cyber Safety Process Infographic

Infographic | Process

Online Editable Birthday Party Checklist Process Infographic

Online Editable Birthday Party Checklist Process Infographic

Infographic | Process

Online Editable Steps for Fitness Training Process Infographic

Online Editable Steps for Fitness Training Process Infographic

Infographic | Process

Online Editable Awareness of Tobacco Consumption Statistics Infographic

Online Editable Awareness of Tobacco Consumption Statistics Infographic

Infographic | Statistics

Online Editable Successful Startups Business Process Infographic

Online Editable Successful Startups Business Process Infographic

Infographic | Process

Online Editable Real Estate 2020 Investing Statistics Infographic

Online Editable Real Estate 2020 Investing Statistics Infographic

Infographic | Statistics

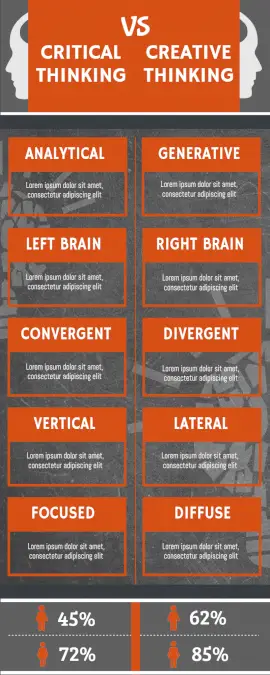
Online Editable Critical Thinking vs Creative Thinking Comparison Infographic

Online Editable Critical Thinking vs Creative Thinking Comparison Infographic

Infographic | Comparison

Online Editable Web Design Process Infographic

Online Editable Web Design Process Infographic

Infographic | Process

Online Editable The Brief History of RAM Timeline

Online Editable The Brief History of RAM Timeline

Infographic | Process

Online Editable Flood Insurance Statistics Infographic

Online Editable Flood Insurance Statistics Infographic

Infographic | Statistics

Online Editable Signs of a Heart Attack Comparison Infographic

Online Editable Signs of a Heart Attack Comparison Infographic

Infographic | Comparison

Online Editable Modern Marketing Hard and Soft Skills Comparison Infographic

Online Editable Modern Marketing Hard and Soft Skills Comparison Infographic

Infographic | Comparison

Online Editable How Do Vaccines Work in Our Body Process Infographic

Online Editable How Do Vaccines Work in Our Body Process Infographic

Infographic | Process

Online Editable Software Development Life Cycle Process Infographic

Online Editable Software Development Life Cycle Process Infographic

Infographic | Process

Online Editable The Story of Chocolate Timeline Infographic

Online Editable The Story of Chocolate Timeline Infographic

Infographic | Timeline

Online Editable 8 Steps for Effective Sales Process Infographic

Online Editable 8 Steps for Effective Sales Process Infographic

Infographic | Process

Online Editable Causes of Plastic Pollution Statistics Infographic

Online Editable Causes of Plastic Pollution Statistics Infographic

Infographic | Statistics

Online Editable Spooky Halloween Financial Statistics Infographic

Online Editable Spooky Halloween Financial Statistics Infographic

Infographic | Statistics

Online Editable How to Do Smart Study Process Infographic

Online Editable How to Do Smart Study Process Infographic

Infographic | Process

Online Editable Media Buying Comparison Infographic

Online Editable Media Buying Comparison Infographic

Infographic | Comparison

Online Editable Chocolate Chip Cookies Recipe Process Infographic

Online Editable Chocolate Chip Cookies Recipe Process Infographic

Infographic | Process

Online Editable Hydrological Cycle Process Infographic

Online Editable Hydrological Cycle Process Infographic

Infographic | Process

Online Editable Burger Anatomy Statistics Infographic

Online Editable Burger Anatomy Statistics Infographic

Infographic | Statistics

Online Editable Visual Content Benefits Statistics Infographic

Online Editable Visual Content Benefits Statistics Infographic

Infographic | Statistics

Online Editable Future of Cybersecurity in Next 5 Years Process Infographic

Online Editable Future of Cybersecurity in Next 5 Years Process Infographic

Infographic | Process

Online Editable Cloud vs Desktop Accounting Comparison Infographic

Online Editable Cloud vs Desktop Accounting Comparison Infographic

Infographic | Comparison

Online Editable Elon Musk Life History Timeline Infographic

Online Editable Elon Musk Life History Timeline Infographic

Infographic | Timeline

Online Editable Apple History Timeline Infographic

Online Editable Apple History Timeline Infographic

Infographic | Timeline

Online Editable Advertising Campaign Planning Process Infographic

Online Editable Advertising Campaign Planning Process Infographic

Infographic | Process

Online Editable Coffee Calories Statistics Infographic

Online Editable Coffee Calories Statistics Infographic

Infographic | Statistics

Online Editable Differences Between eLearning and mLearning Comparison Infographic

Online Editable Differences Between eLearning and mLearning Comparison Infographic

Infographic | Comparison

Online Editable History of Hacking Timeline Infographic

Online Editable History of Hacking Timeline Infographic

Infographic | Timeline

Online Editable Increase Memory Power Process Infographic

Online Editable Increase Memory Power Process Infographic

Infographic | Process

Online Editable E-learning Statistics Infographic

Online Editable E-learning Statistics Infographic

Infographic | Statistics

Online Editable Creative Design Ideas Steps Process Infographic

Online Editable Creative Design Ideas Steps Process Infographic

Infographic | Process

Online Editable Seasonal Rainfall Statistics Infographic

Online Editable Seasonal Rainfall Statistics Infographic

Infographic | Statistics

Online Editable Fiction vs Nonfiction Comparison

Online Editable Fiction vs Nonfiction Comparison

Infographic | Comparison

Online Editable Snapchat vs Instagram Social Media Comparison Infographic

Online Editable Snapchat vs Instagram Social Media Comparison Infographic

Infographic | Comparison

Online Editable Minimalist Protein Rich Foods Statistics Infographic

Online Editable Minimalist Protein Rich Foods Statistics Infographic

Infographic | Statistics

Online Editable Business Process Reengineering Process Infographic

Online Editable Business Process Reengineering Process Infographic

Infographic | Process

Listing 1 - 43 (out of 65) Infographics templates

Start with Infographic templates

Infographic templates are pre-designed with charts, text, maps, and other data visualization features, which you can customize with your own data by just editing it.

Make your own Infographics design

Create your own professional-looking infographics with all the available assets like relevant data matrix based on the data reports that you would like to display in a more appealing form.

Couldn't find what you're looking for?

We frequently update unique Infographic templates for all our categories and If you have specific needs, you can send your request and we’ll create new templates for you.

Learn more about the Infographic maker

Choose a template

Choose from 65 easy-to-edit high-resolution infographic templates available with amazing data visualization features and create attractive infographics to display the convincing data.

and then

Perfectly optimized and highly customizable  

All the infographic templates of WoFox are customizable with the appropriate data visualization tools like Diagrams, Data Widgets, Photos and Graphics also can be optimized with the standard size 800 x 2000 px.

and finally

Download to share

Done with your infographic? Now you can download it in HD without the WoFox watermark and share it on blogs, websites and other social media platforms.

Tips and strategies for awesome intro video creation

Infographics are mostly used by people in finance and marketing as they are able to clearly put forward a communicating piece of data easily, but there are also some strategies to create a successful Infographics.

Tip 1: Use visual features like Graphs and Charts

Making use of Graphs, Charts, Diagrams, Data Widgets, Photos, and Graphics will automatically enhance the visual impact of your infographics and it will grab the attention of more audiences.

The importance of charts, graphs, and other data forms are shared by MindTool.

Tip 2: Update your facts and figures

Always update your facts and statistics in the infographics over the years. Be on-trend. Neil Patel says to make sure that the statistics themselves are true, your sources are reliable and your graphical representation of the data lines up with the number(if available).

Tip 3: Make use of call-to-action

Adding a call-to-action to your infographic design is a way to lead the audience to view your next infographic design which will automatically get you more audience. So never forget to make use of call-to-action at the end of your Infographic.

Got a Question?

(Our experts will answer it)

1. Is it possible to embed the infographics made with WoFox on my blog?

Yes, it is definitely possible to embed your infographic design on your blog. Just click on the embed option, copy the code and paste it on your blogs. Create and embed the infographic using WoFox templates.

2. Can I share full infographics on the Facebook post?

It doesn't look good to upload full/long infographics on Facebook. You can create and upload multiple parts of your infographics like a photo carousel and photo album. ==more=== Also, link the blog, Pinterest or website in which your full infographic is hosted. So that it can drive the audience to view your full visual content. Know more about ideas about posting infographics to facebook here.

Size requirements for Infographics

Create the best infographic design online for your data with a clear idea of the size guide of infographics. WoFox helps you to create an infographic with a standard size of 800 x 2000 px which makes it easy for the users to share it on blogs, websites and social platforms.

The major motive of creating an infographic is to produce the data in a form that everybody understands. But for that, you should place your data in proper order. Here is a safe area to create an infographic design.

  • Go for vertical infographics as it is more convenient for the users to read.
  • Add the title at the top of the infographic design to give a clear idea to the readers.
  • The important content part should be placed at the center as it makes the users to easily go through the important contents.
  • The icons and charts should be added besides the content to add more details to the content.

Make visually communicating data with WoFox's Infographics templates.

Professional infographic designs for blogs, websites and other social media platforms that grab the attention of viewers easily.

Create More Effective Digital Content with WoFox Platform